Return Benchmark 2025.
The latest data on return rates, peak season trends, customer behaviour, and operational challenges in
e-commerce.
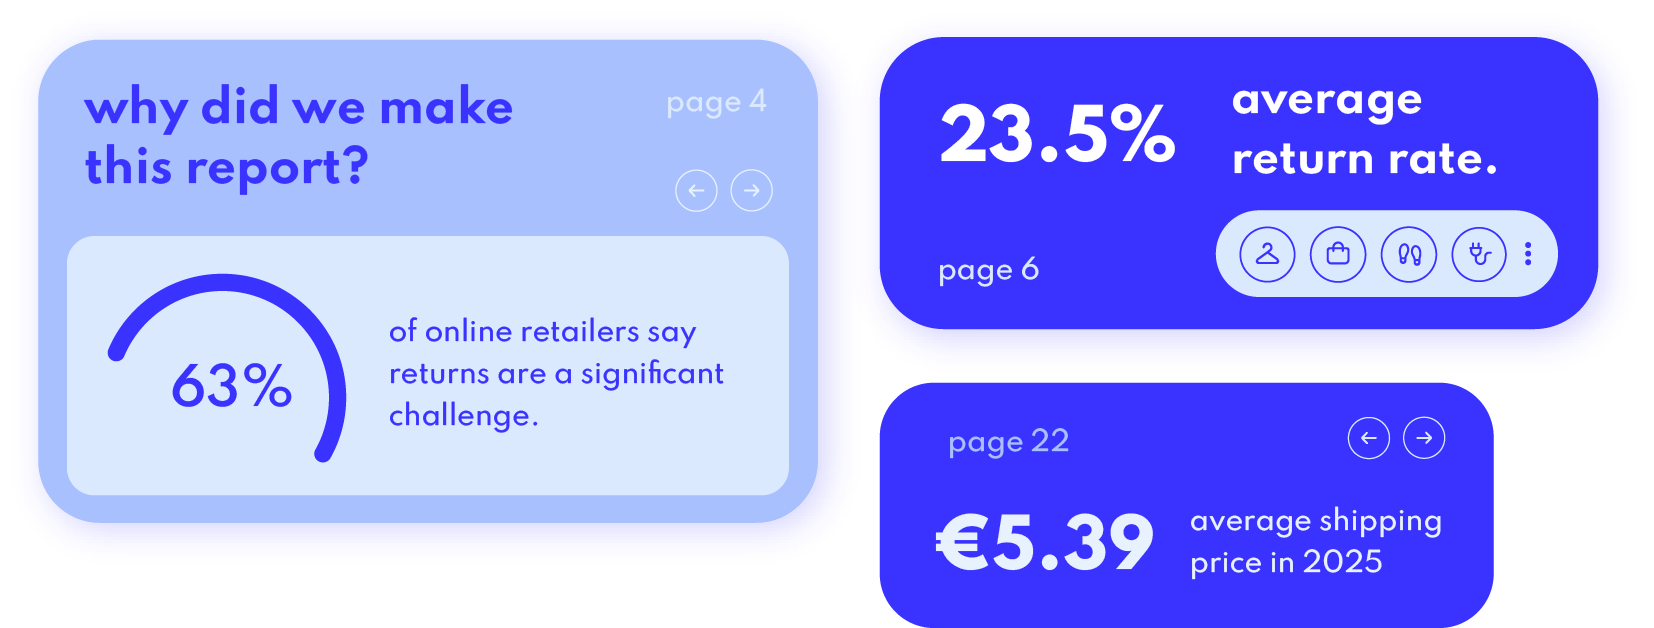
The Return Benchmark 2025 is a data-driven report that combines the experience of 1250+ webshops in Europe, Returnless platform data and market trends, into one Benchmark with 30+ insights about returns during peak season.
Key findings at a glance
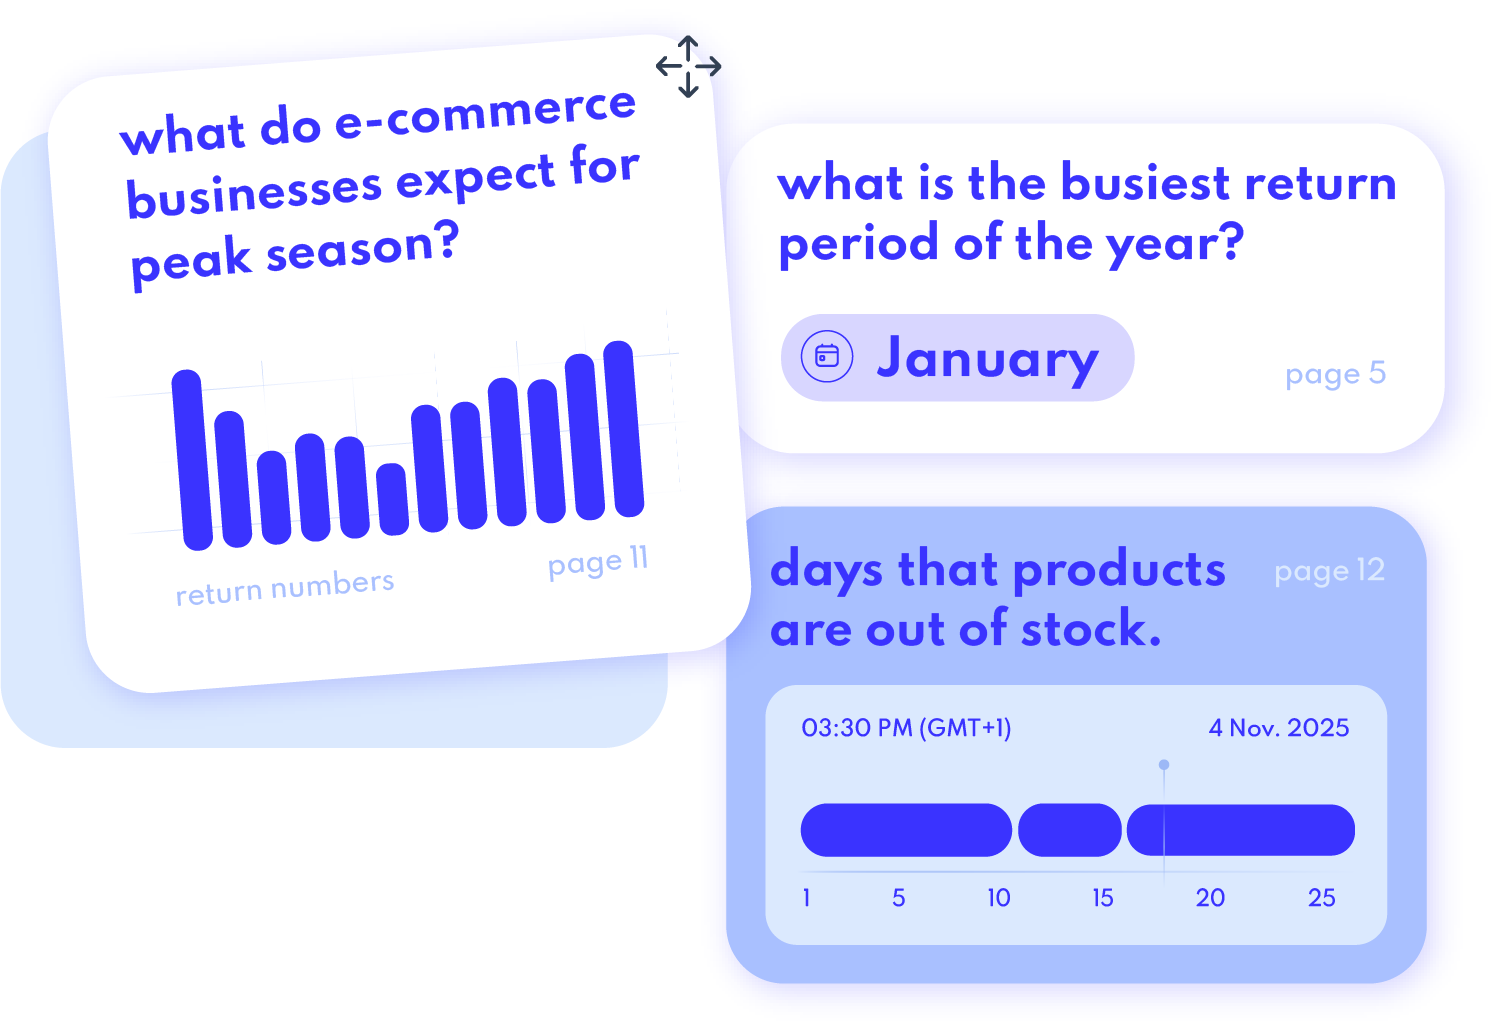
44.5% increase in return volume during peak season (Dec-Feb)
January is the busiest return month of the year
23.5% average return rate across e-commerce brands
“Product not as expected” is the #1 return reason
€5.39 average return shipping price in 2025
Download the full Benchmark
return rates
industry return rates remain high.
Return rates, the percentage or orders that are returned, continue to be a major cost driver for online retailers. High return rates increase operational workload, carrier costs, and customer service pressure. Especially during peak season. According to our Benchmark, the average return rate is 23.5% across e-commerce brands and the average shipping costs, the fee carriers charge for transport, are €5.39 in 2025.
peak season trends
peak season drives a 44.5% surge in return volume.
During peak season, from December to February, return activity spikes with volumes rising 44.5% compared to the rest of the year. Retailers must prepare warehouse staffing and their workflows well ahead of January, which is the busiest return month in the year.
customer behaviour
“Product not as expected” is the #1 return reason.
The most common return reason, the customer’s stated reason for sending an item back, is that products are not as expected. Improving product descriptions, imagery, sizing guides, and material details can significantly reduce preventable returns.
a short message from our co-founders.
“The upcoming peak season will be a real test of efficiency for many online retailers. Webshops that have invested in a solid return process over the past year will undoubtedly benefit during the busiest time of the year. That’s when you want your returns to run on autopilot as much as possible.”
“During peak season, discounts send order volumes through the roof, but returns rise just as fast. That’s why it’s smart to think about the goal behind your discount strategy. Are you going for more revenue, better margins, or hoping to win new loyal customers?”
FAQ.
What are the key return management trends for 2025?
The key return trends for 2025/2026 include higher return volumes and rising costs, which drive more retailers to adopt paid returns and revenue retention solutions such as store credit.
Operationally, in-store returns and automated return flows are on the rise as merchants look to reduce workload. Automations help merchants to handle high return volumes more efficiently.
Sustainability also remains a major trend, with retailers aiming to reduce unnecessary shipments and improve circularity across the return journey.
What are the top innovations in return logistics this year?
Return logistics innovations in 2025/2026 focus on automation, data intelligence, and customer experience. The most impactful developments include omnichannel return processes, integrating return data into inventory planning, and automatic refunds and store credit.
Which tools help e-commerce brands reduce return costs?
Tools that reduce return costs in 2025/2026, such as Returnless, include automated return processes, branded return forms, and strong analytics to identify return risks, return reasons and predict high return volumes. Possible integrations with WMS, ERP, and e-commerce platforms streamline processing and reduce warehouse handling time.
How much do return volumes increase during the peak season?
Return volumes increase significantly during peak season, typically rising 44.5% between December and February. January is consistently the busiest month of the year. This surge occurs due to holiday gifting, seasonal purchases, and increased sales.
How can retailers improve their return policy to adapt to return trends and paid return models?
Retailers can improve their return policy by making conditions clearer, offering multiple return solutions, and possibly applying paid returns. Paid return models perform best when applied in different circumstances and combined with transparent communication. Policy improvements often include extended or shorter return windows during peak season, products that are excluded from returns, and guidelines for returned sale-items.
How can better return processing improve customer satisfaction in 2025?
Customer satisfaction improves when returns are easy, self-service and fast. In 2025/2026, customers expect automated updates, easy label generation, and flexible return methods including drop-off points, in-store returns and easy exchanges.
What are the most important return statistics in e-commerce?
The most important return statistics include the average return rate, the increase in returns during peak season, the most common return reasons, and the average return shipping costs. In 2025, the average return rate is 23.5%, peak season volumes rise by 44.5%, “product is not as expected” is the top return reason, and the average return shipping costs are €5.39.